
Quantitative Data Management, Analysis and Visualization With Python Worshop 2025
Описание
Workshop on Quantitative Data Management, Analysis, and Visualization with Python for beginners and seasoned developers. Learn to analyze big data, create visualizations, and apply machine-learning algorithms.
Основное
10-day workshop on quantitative data management, analysis, and visualization using Python. Designed for both beginners and seasoned developers. Covers data cleaning, preprocessing, exploratory data analysis, and advanced data manipulation. Includes modules on statistical analysis, time series analysis, and data visualization with Matplotlib and Seaborn. Hands-on exercises and practical examples to leverage Python's powerful libraries. Ideal for professionals in fields such as agriculture, economics, food security, and public health. Focuses on deriving actionable insights and making data-informed decisions. Includes interactive visualizations with Plotly and Dash, and machine learning basics. Covers automation and scripting with Python, and working with big data. Addresses data ethics and privacy.
Место проведения
Расскажите своей сети, что вы идёте
Поделитесь этим событием, чтобы начать разговоры, пригласить коллег и наладить контакты до его начала.
Похожие события
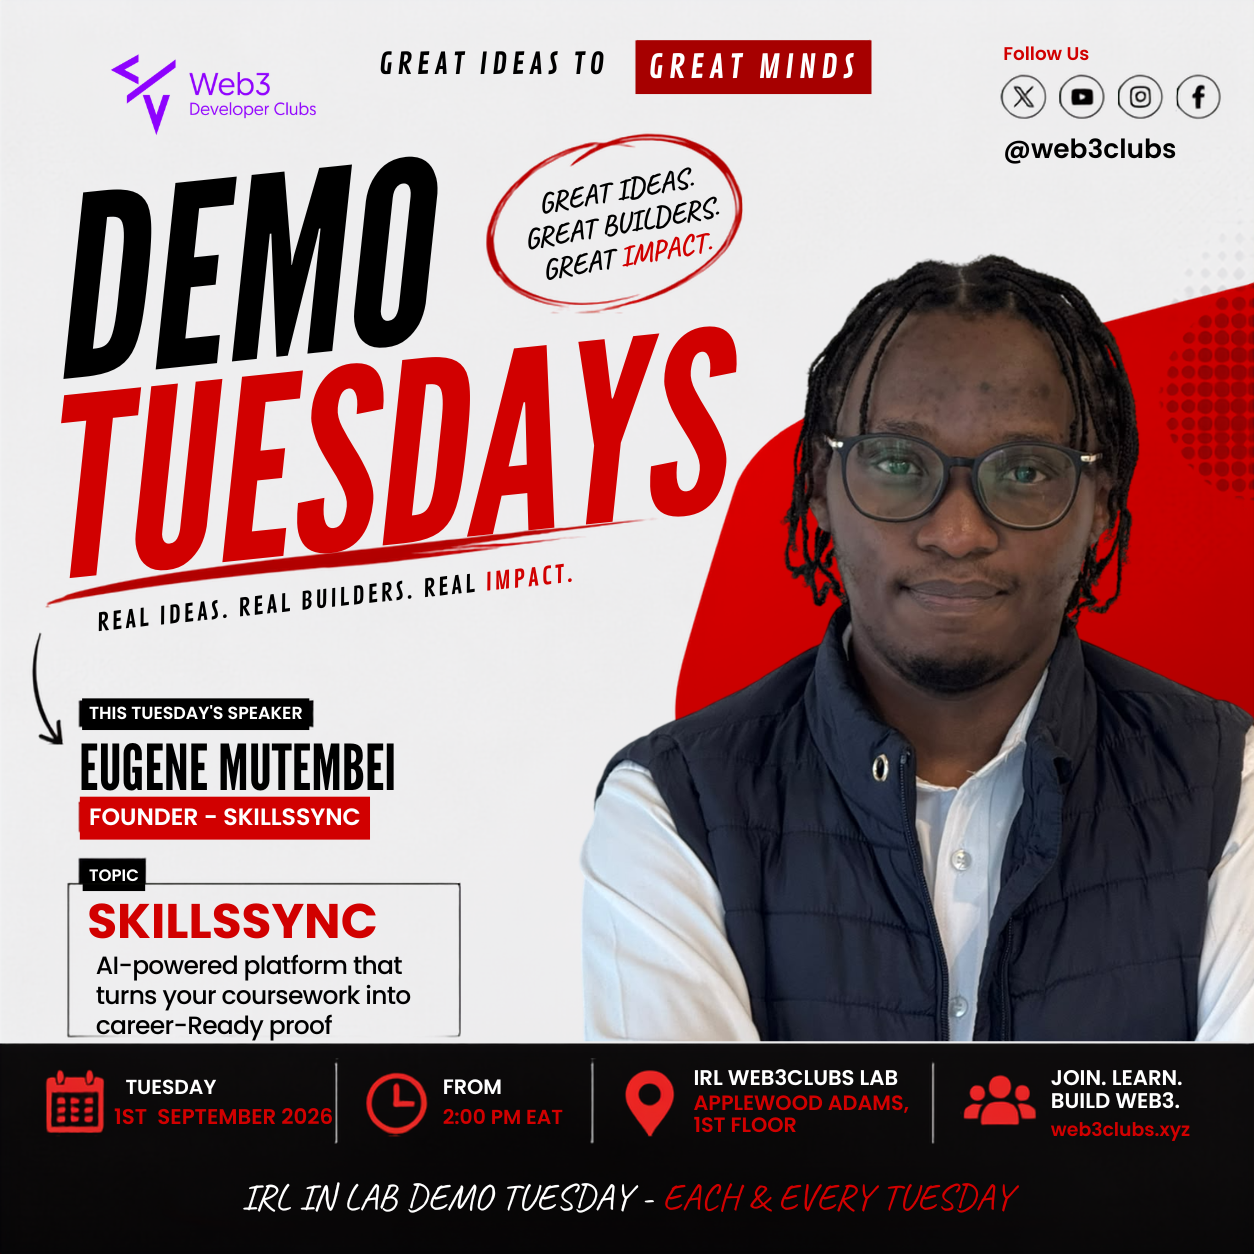
ДЕМОНСТРАЦИЯ В НАВАНГЕНДЕ
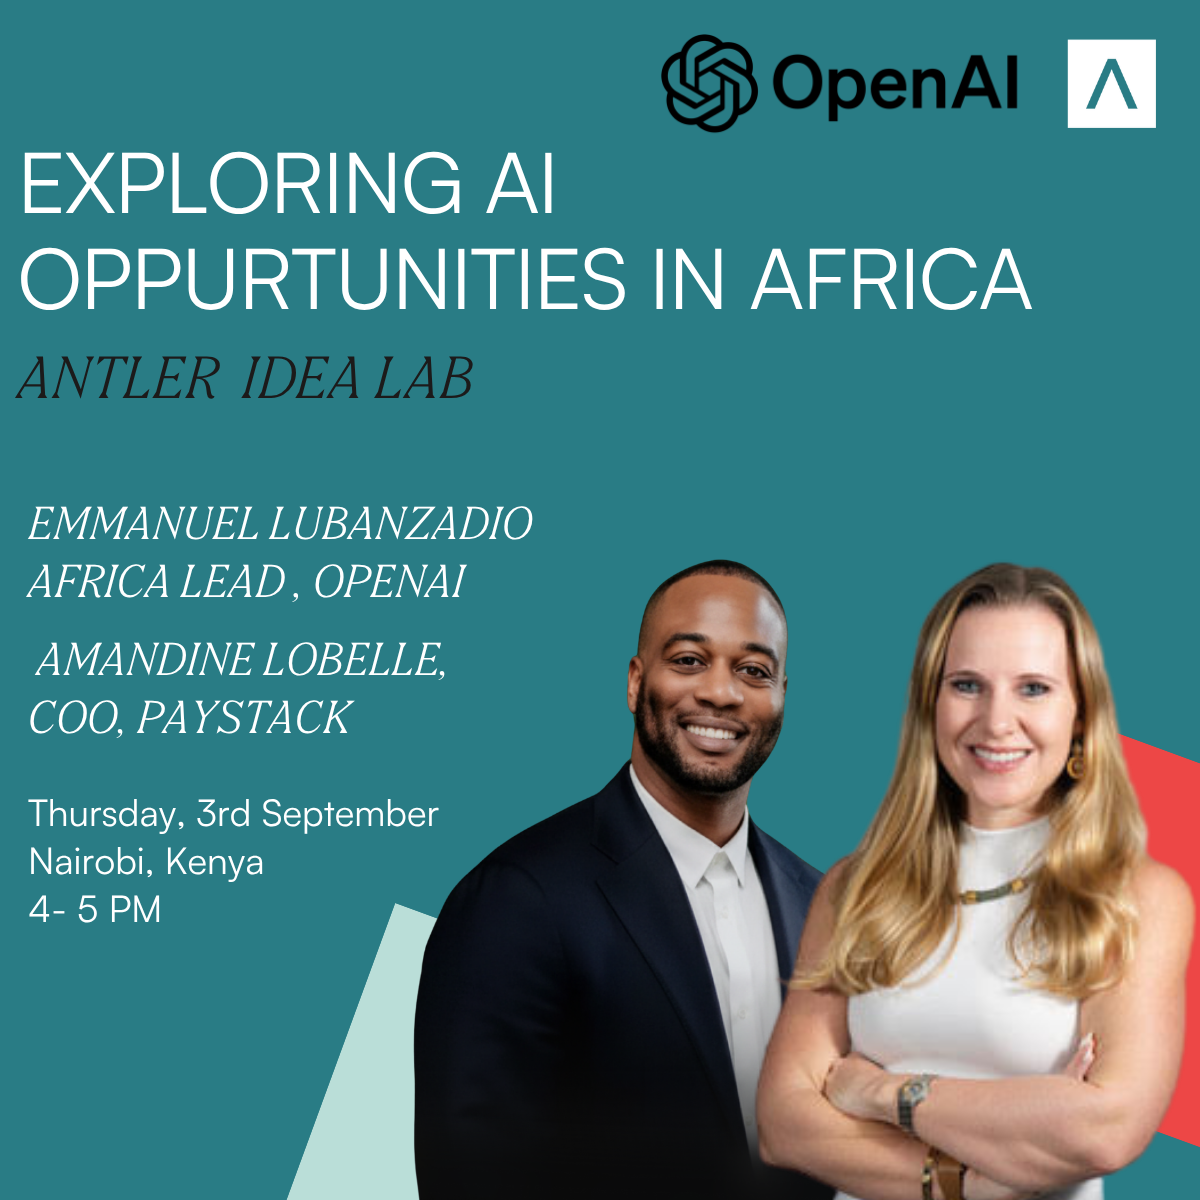
Исследование возможностей ИИ - с Antler и OpenAI
Наироби | Claude Impact Lab - AI Mashinani 02
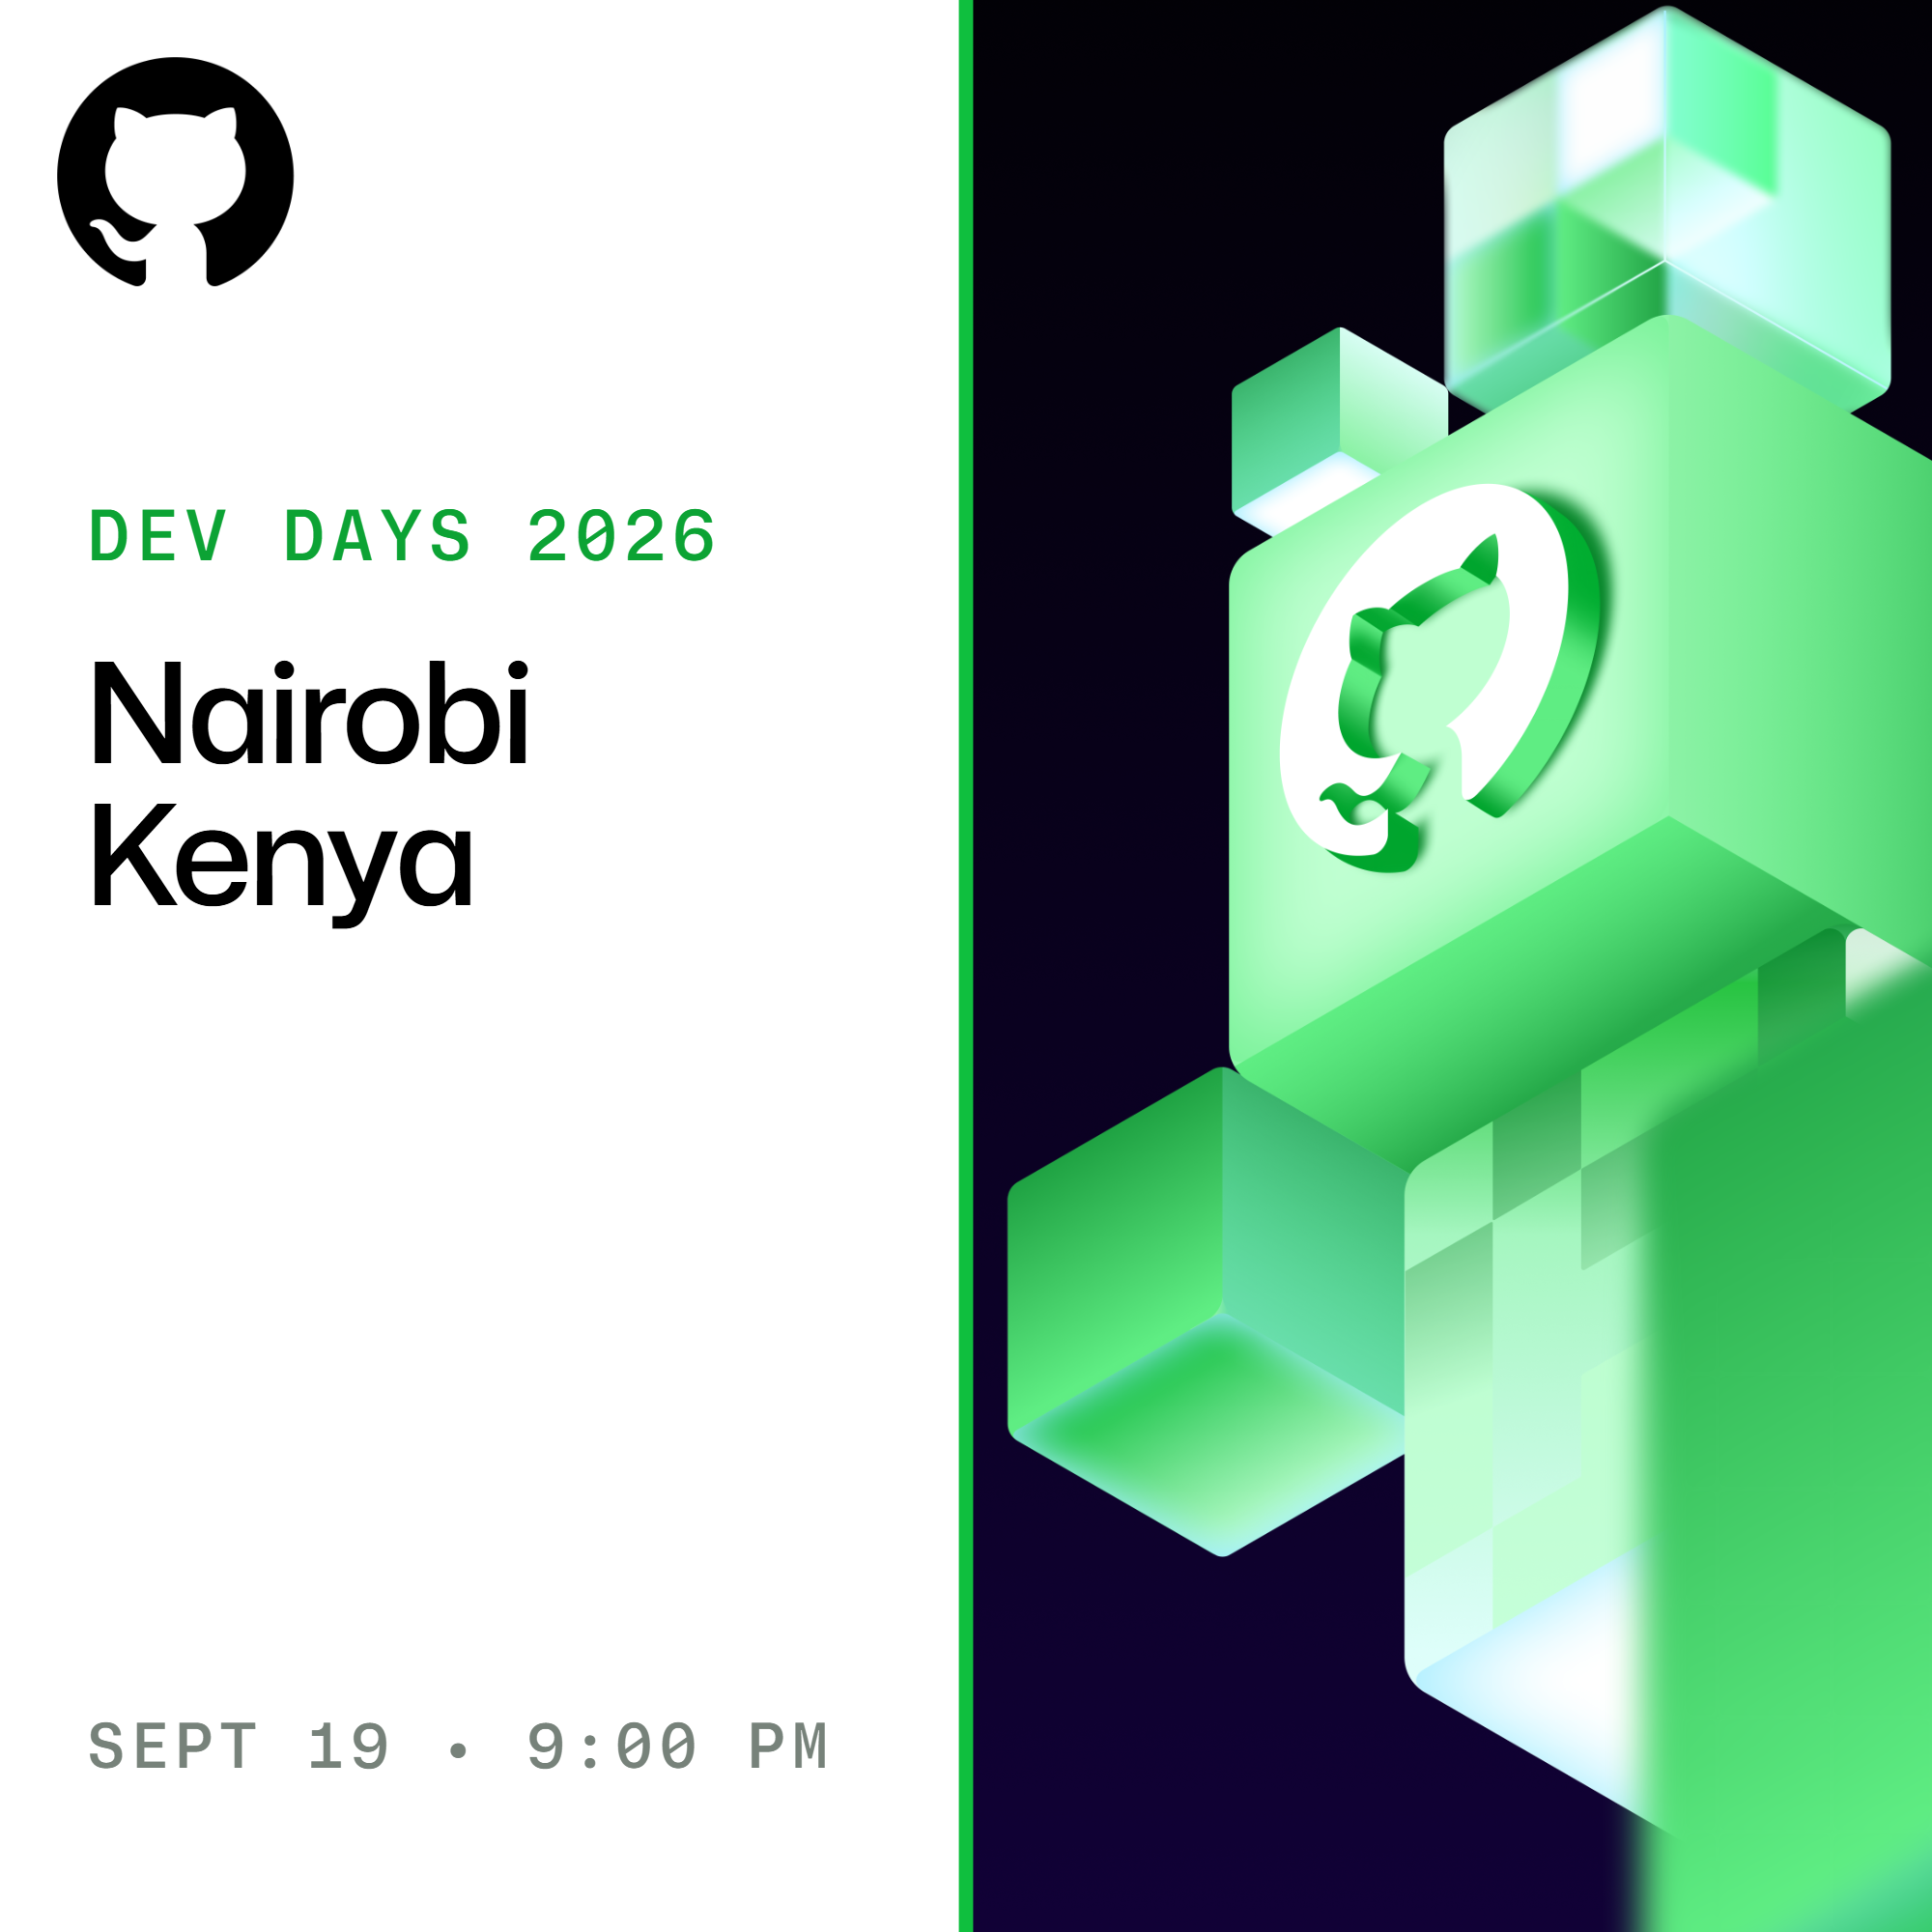
Дев Дни | Найроби, Кения

Строительство с использованием ИИ: беседа у камина; от идеи до рабочей модели продукта
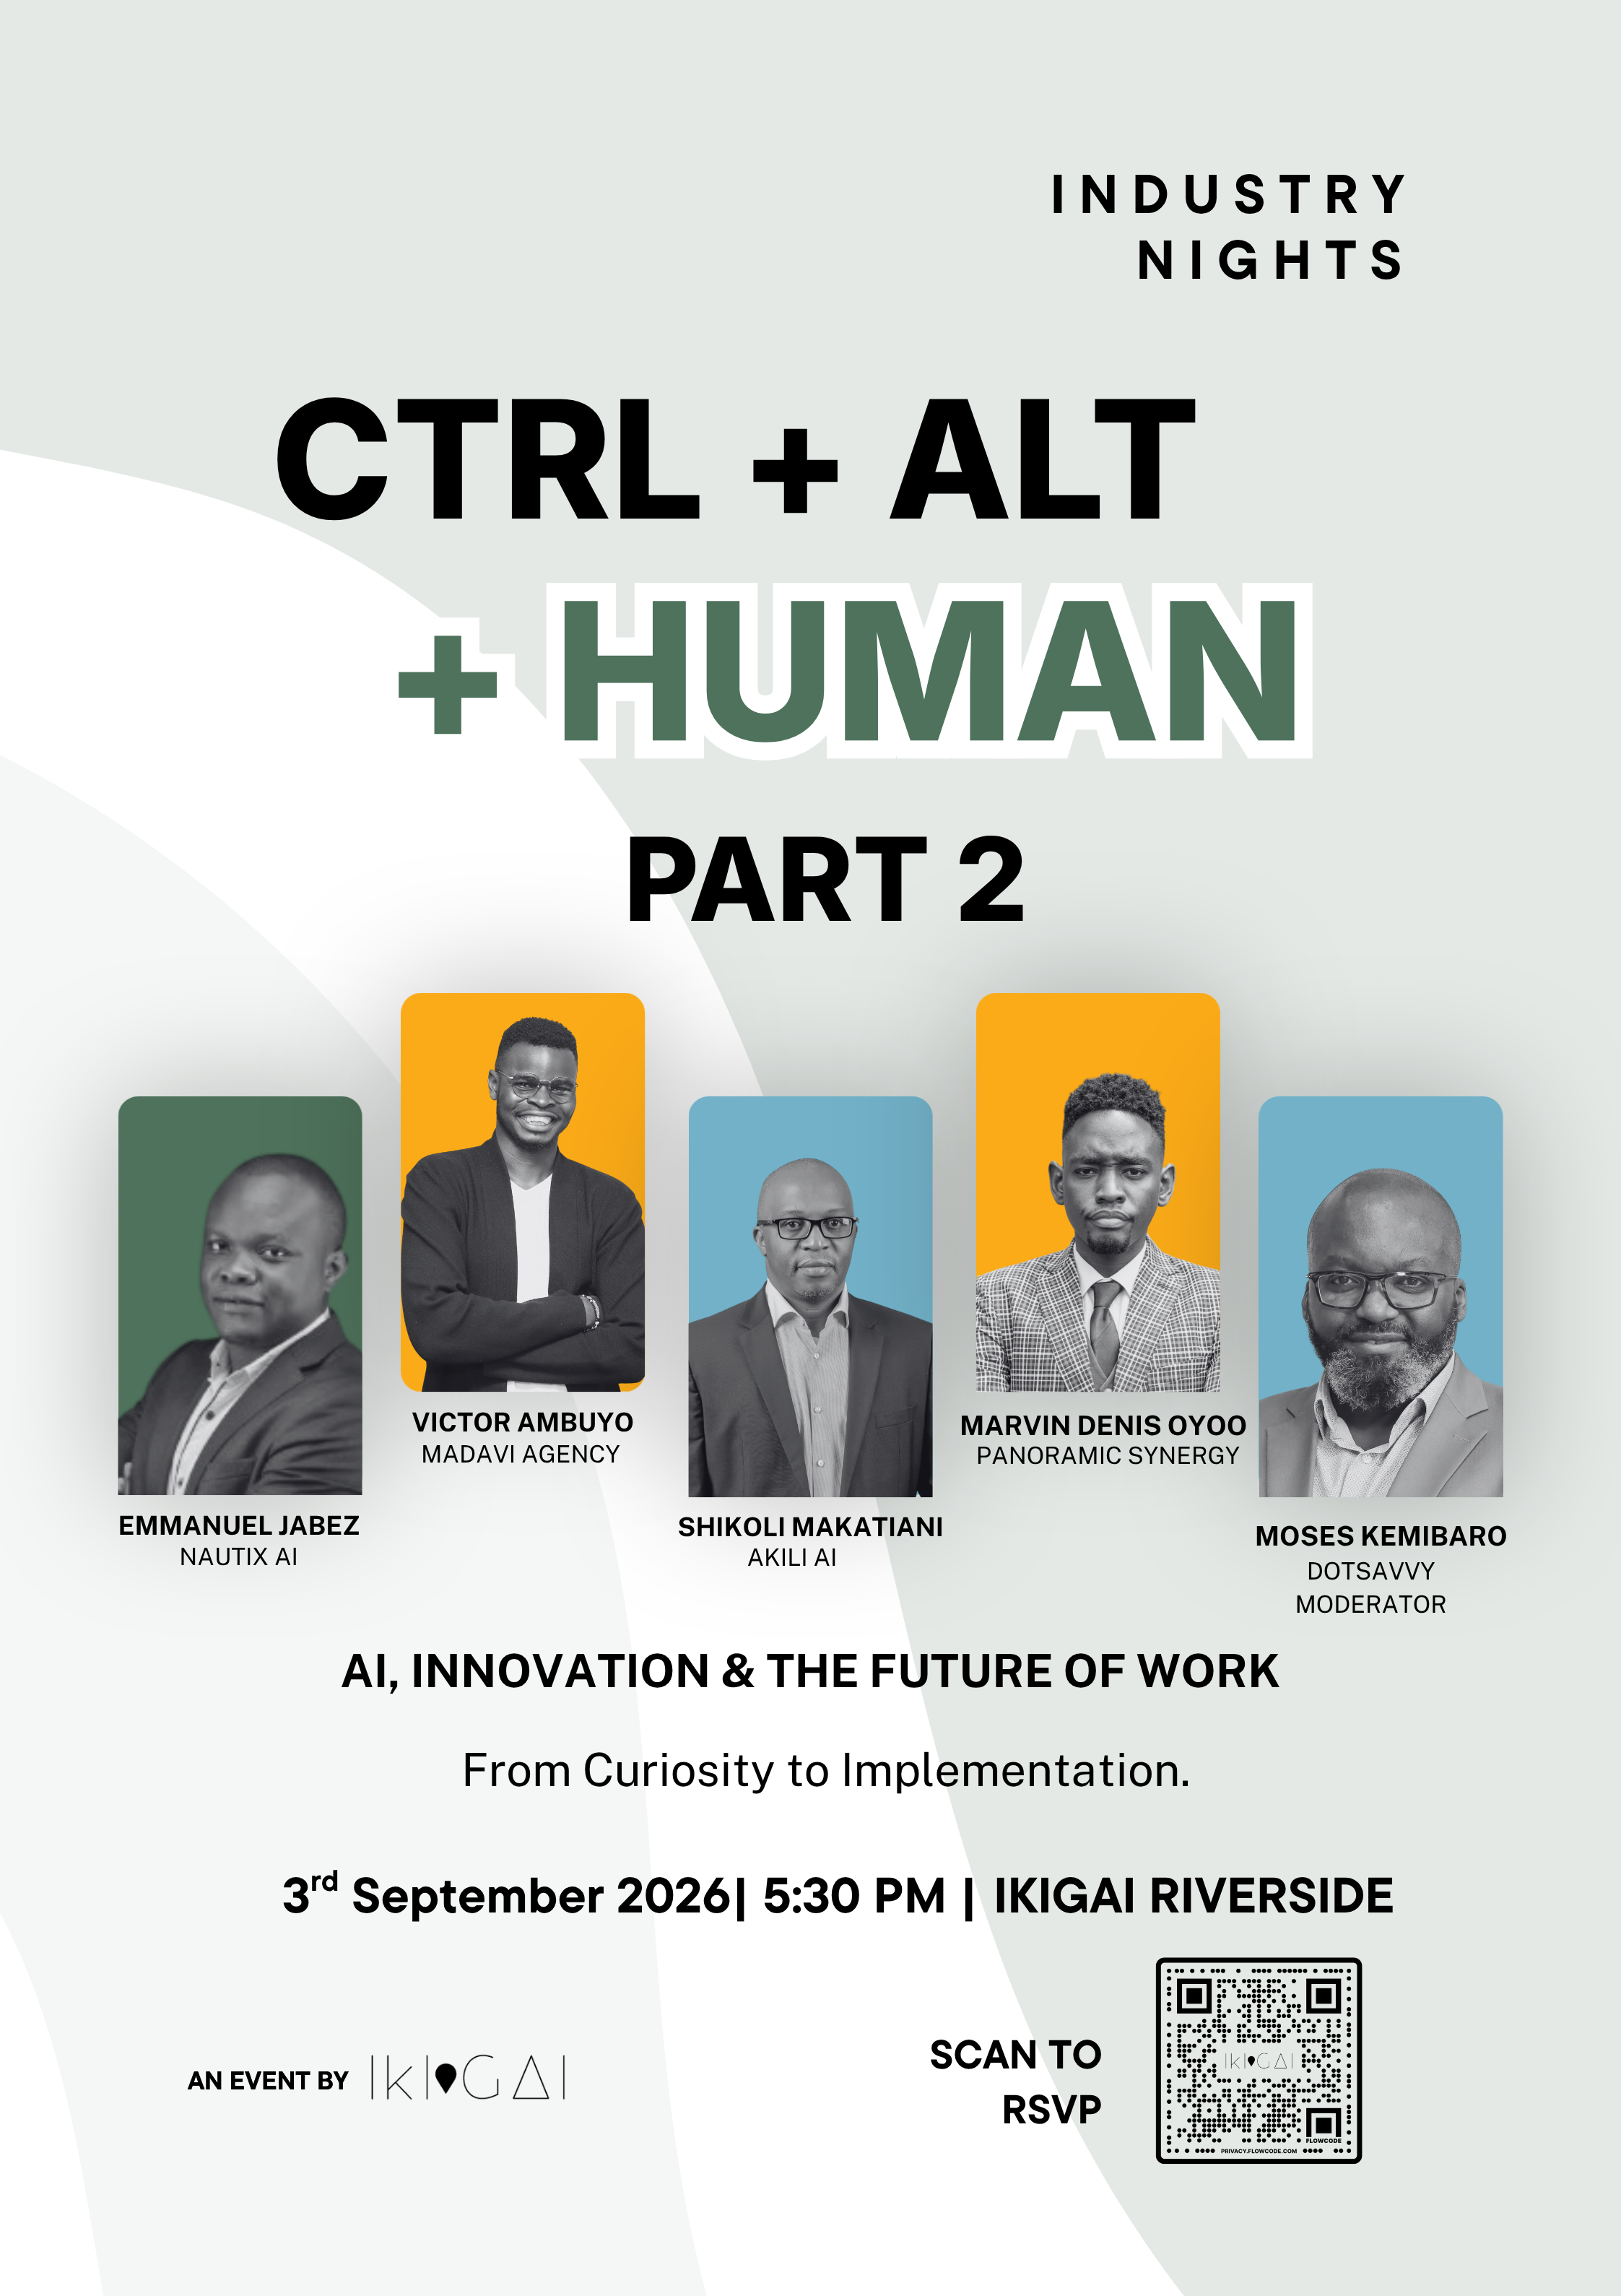
CTRL + ALT + HUMAN ЧАСТЬ 2: От любопытства к реализации
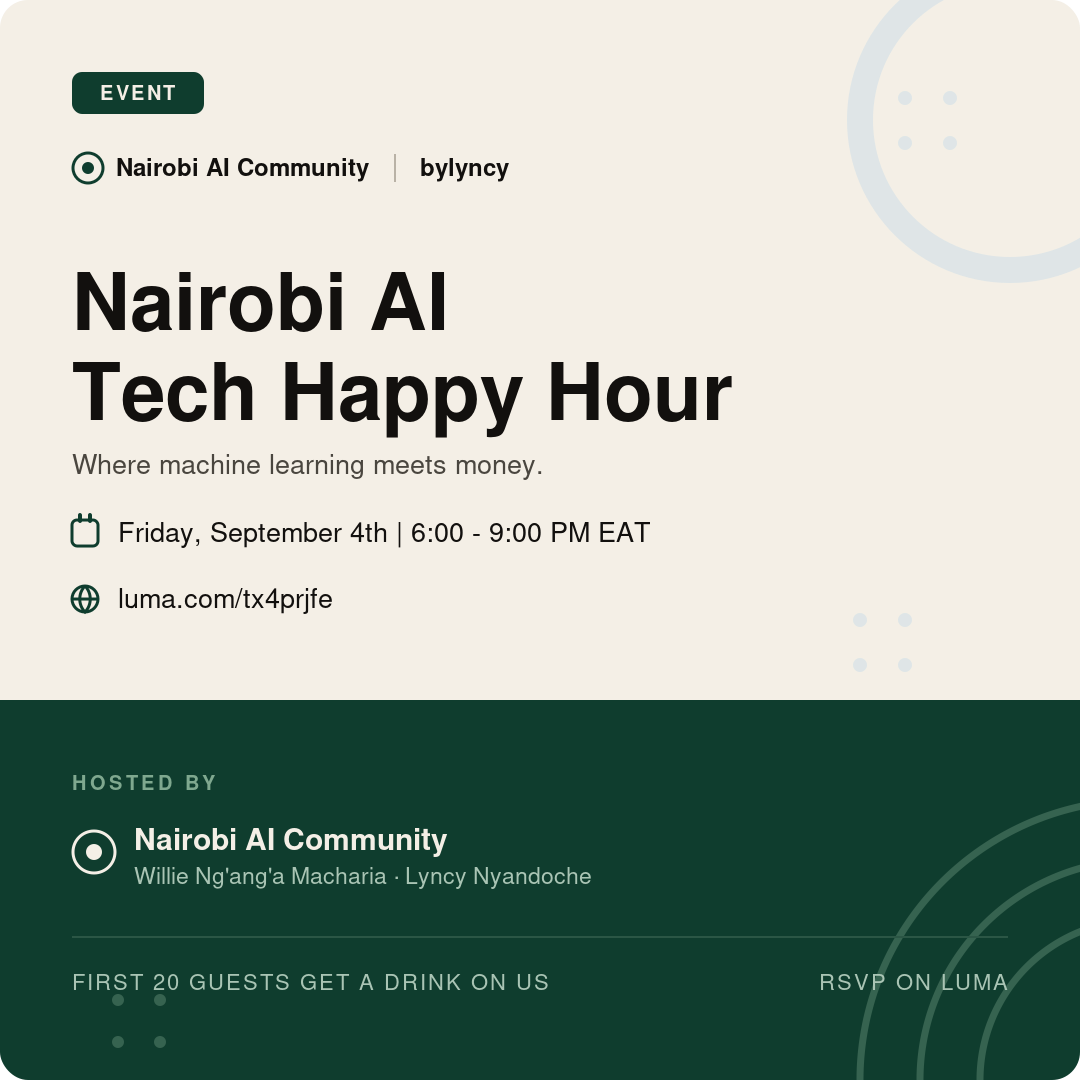
Счастливый час технологий и финансов AI в Найроби